
GBP/JPY Price Forecast
- GBP Sterling Charts and Analysis
- GBP/JPY price action.
Have you checked our latest trading guide for USD and Gold? Download for free our Q3 Forecasts
GBP/JPY – Stuck in a Sideways Move
On July 3, GBP/JPY tested 135.55 for second time since June 18 and could not close below, causing a trendless movement.
The Relative Strength Index (RSI) rose from 33 to 40 indicating to the lack of momentum to kick start an upside nor a downside move for now.
Just getting started?See our Beginners’ Guide for FX traders
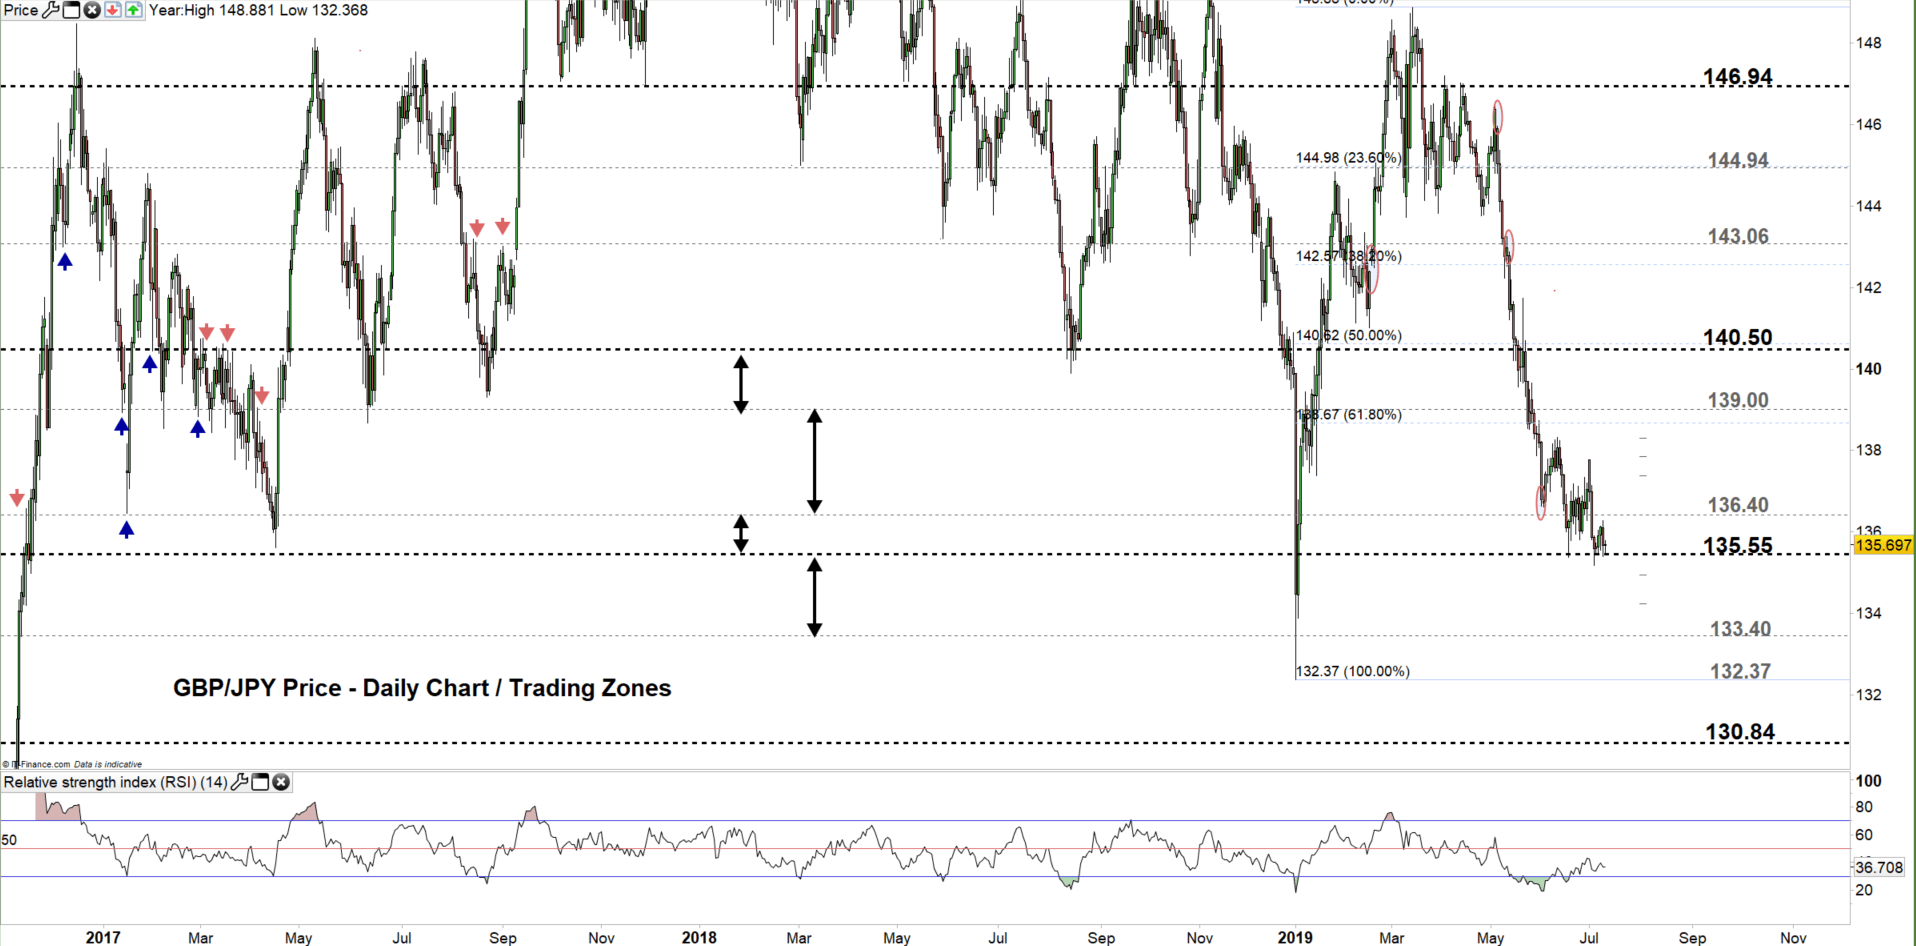
GBP/JPY DAILY PRICE CHART (Oct 13, 2016 – JULY 10, 2019) Zoomed out
GBP/JPY DAILY PRICE CHART (April 18 – JULY 10, 2019) Zoomed IN

Looking at the daily chart we notice GBP/JPY moving in a narrow trading zone 135.55 – 136.40. On July 3 the price tested the low end of this zone and after failing to close below the pair eyes currently a test of the high end.
A close above the high end of the aforementioned trading zone may cause a rally towards 139.00, nonetheless; the weekly resistance levels underlined on the chart (Zoomed in) should be watched along the way.
In turn, a close below the low end of the trading zone could press the price towards 133.40, although; the weekly support levels highlighted on the chart need to be kept in focus. See the chart to find out more about the next significant support levels if the selloff continues below 133.40.
Having trouble with your trading strategy? Here’s the #1 Mistake That Traders Make
GBP/JPY Four-HOUR PRICE CHART (JunE 26 – July 10, 2019)

Looking at the four-hour chart, we notice 0n July 3 GBP/JPY rebounded from 135.17 – its lowest level in six months. Since then the price rallied and never tested this area, hence; any break to this level might send it towards 134.50 to test the downtrend line originated form the June low at 135.81, although; the weekly support level marked on the chart needs to be considered.
On the other hand, a rally above 136.40 may see the price heading towards 136.99, however; the daily resistance underlined on the chart should be watched closely. See the chart to find out more about the key chart points if the rally continues above mentioned levels.
Written By: Mahmoud Alkudsi
Please feel free to contact me on Twitter: @Malkudsi
https://www.dailyfx.com/free_guide-tost.html?ref-author=Alkudsi