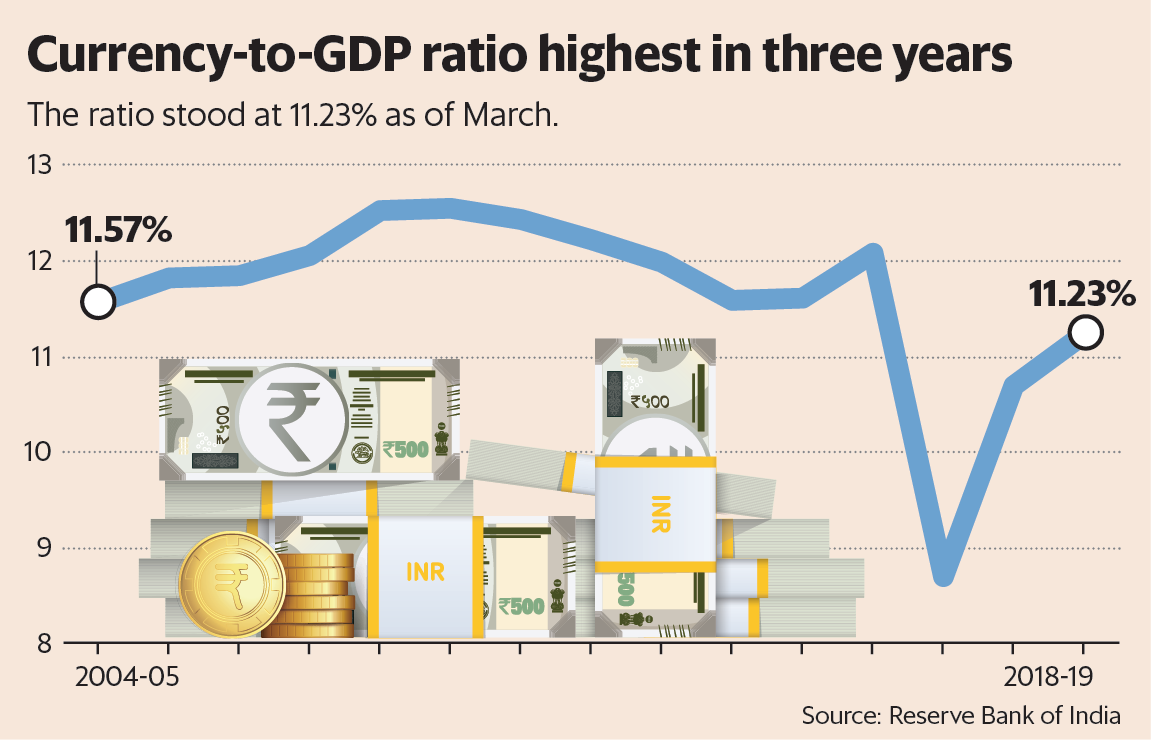
The currency in circulation as on 29 March stood at ₹21.40 trillion. It was up by 60.2% from ₹13.35 trillion as of March 2017, the end of the fiscal in which demonetization took place. Mint dwells on what this means for the Indian economy.
How has the situation changed since the note ban on 8 November 2016?
On 4 November 2016, the currency in circulation, or the total amount of cash in the financial system, was at ₹17.98 trillion. This fell to a low of ₹8.98 trillion as of 6 January 2017, in the aftermath of the note ban. It crossed the pre-note ban level only in early March 2018. As of March-end this year, the currency in circulation was around 19% more than the pre-demonetization level. The Indian economy has also grown since then. Hence, it isn’t fair to look at currency in circulation in isolation. The size of the Indian economy needs to be taken into account as well.
What is the ratio of currency in circulation to gross domestic product (GDP) as of March 2019?
The ratio of currency in circulation to GDP takes into account the size of the Indian economy. As any economy grows, the total amount of currency being used in it also grows in absolute terms. Hence, it is important to take the size of the economy into account. The currency-to-GDP ratio as of March was 11.23%. The chart shows this is the highest in three years. The currency-to-GDP ratio as of March 2017 and March 2018 was 8.69% and 10.70%, respectively. Hence, the currency-to-GDP ratio has grown between March 2017 and March 2019.
What was the ratio of the currency to GDP before demonetization?
If we average the currency-to-GDP ratio between 2004-05 and 2015-16—the years before demonetization—it comes to 12.03%.

What does the ratio tell us?
The currency-to-GDP ratio tells us that it continues to grow in the aftermath of demonetization towards the long-term Indian average of around 12% of gross domestic product. Considering the presence of a huge informal sector in the Indian economy, a higher currency-to-GDP ratio suggests that economic transactions in the informal sector are picking up pace again, even though they are still not back to the pre-demonetization levels. This is clearly good news for the Indian economy.
Does more currency in the economy lead to higher corruption?
The ratio of currency to GDP of Japan in 2017 was 20.44%, much higher than that of India. Japan is less corrupt than India. The currency-to-GDP ratio of Nigeria in 2016 was 1.85%. Yet Nigeria is a lot more corrupt than India. While people may take bribes in the form of cash, it does not mean that they hold on to that cash in the form of wealth. The cash is typically used to buy real estate and gold.
Vivek Kaul is an economist and the author of the Easy Money trilogy
