
As you know, once a week, Splendid Exchange looks at 29 currencies in search of the evidence of popular delusions and the madness of crowds. The idea is to find anomalies and bullish or bearish divergences that will break the trend, not prolong it. It is a painful exercise, but also highly rewarding.
In order to find the most overbought and oversold currency, I conduct five econometric studies: over-extension analysis, secular performance analysis, oil correlation review, economic divergence analysis and effective exchange rate study. Additionally, I look at traders’ positioning to understand the psychological state of the market.
Analyzed currency pairs: AUD/USD, EUR/USD, GPB/USD, NZD/USD, USD/CAD, USD/CHF and USD/JPY.
Relevant ETFs (most popular): CROC, OTC:ERO, EUFX, FXA, FXB, FXC, FXE, FXF, FXY and OTC:GBB.
Macro Forces
Before revealing the results, let me first say a few words about the current global market environment. This is important because global macro conditions cannot be numerically measured and cannot be directly factored into econometrical models. They must be studied in qualitative terms. In my opinion, the most important theme impacting global foreign exchange market right now is the spread of coronavirus and the fear of the second round of lockdowns + possible economic damage that it may cause.
See below the outlook on the world’s major economies (China, the Eurozone and the United States) for two scenarios: one with and one without a second wave of the virus.
 Source: ABN AMRO; Baseline scenario: second wave less severe, no renewed lockdowns; Negative scenario: a second wave of infections and a second lockdown.
Although the risks of a renewed lockdown are still substantial, the baseline scenario assumes that the virus remains reasonably under control. Local outbreaks will continue (as at present) and fresh measures will be taken where necessary, but no national lockdowns will be imposed. However, there still will be sufficient negatives in place to cause a double dip in Q4 2020 and a possible spillover to Q1 2021. Therefore, central banks’ monetary policy is likely to remain “broadly accommodative” (loose credit policy).
While there is no consensus among the economists about the economic prospects for 2021, there is certainly an agreement that growth in 2021 would be sluggish, at best. In addition, central banks’ attempts to normalize monetary policy will be endangered by persistently low inflation.
Forex traders should be on high alert for competitive devaluations as countries across the globe take steps (either implicitly or explicitly) to depreciate the value of their currency in order to spur exports and boost the economy. In this regard, it becomes particularly important to monitor currencies’ relative value. This is exactly what my econometric studies attempt to achieve. Below are the latest results.
Forex Valuation – Latest Results
Below is the complete Forex Market Summary (as of September 10, 2020).
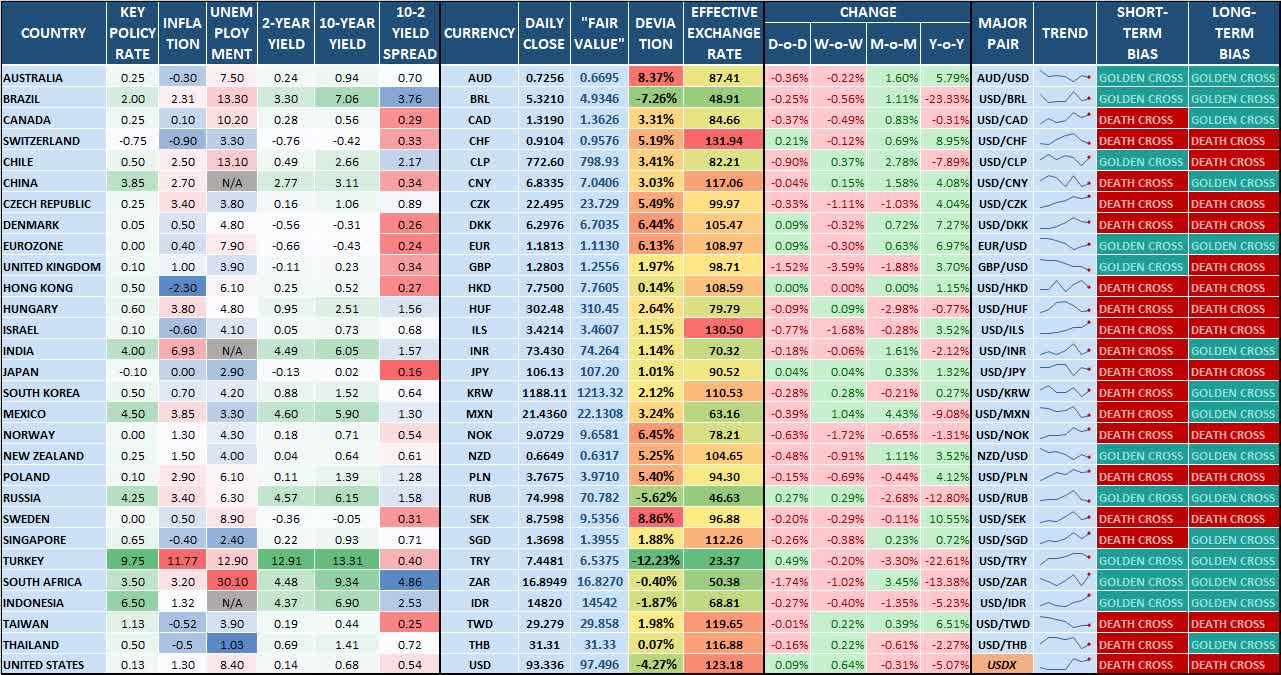 Source: FXCM, Bluegold Trader (website), personal calculations
Description:
- 2-YEAR YIELD – The rate of return or interest paid to the bondholder (investor) of 2-year government bond (yield to maturity, latest close).
- 10-YEAR YIELD – The rate of return or interest paid to the bondholder (investor) of 10-year government bond (yield to maturity, latest close).
- 10-2 YIELD SPREAD – The yield spread between the 10-year government bond and the 2-year government bond.
- “FAIR VALUE” – Hypothetical estimation of a fair value based on four econometric studies.
- DEVIATION – Currency’s exchange rate deviation from the “fair value”.
- GOLDEN CROSS – The golden cross is a candlestick pattern that is a bullish signal in which a relatively short-term moving average crosses above a long-term moving average.
- DEATH CROSS – The death cross is a technical chart pattern indicating the potential for a major selloff. The death cross appears on a chart when a short-term moving average crosses below a long-term moving average.
I will not go through the results of each of the studies, but instead, will illustrate the final ranking. If you want to see the individual results of each of the studies, scroll down to the charts section below.
I have ranked 28 currencies on the scale of -13.0 to +14.0 for each of the studies, where -13.0 indicates “oversold conditions” and +14.0 indicates “overbought conditions.” Therefore, the overall minimum score that any currency can have is -65.0, while the maximum is +70.0.
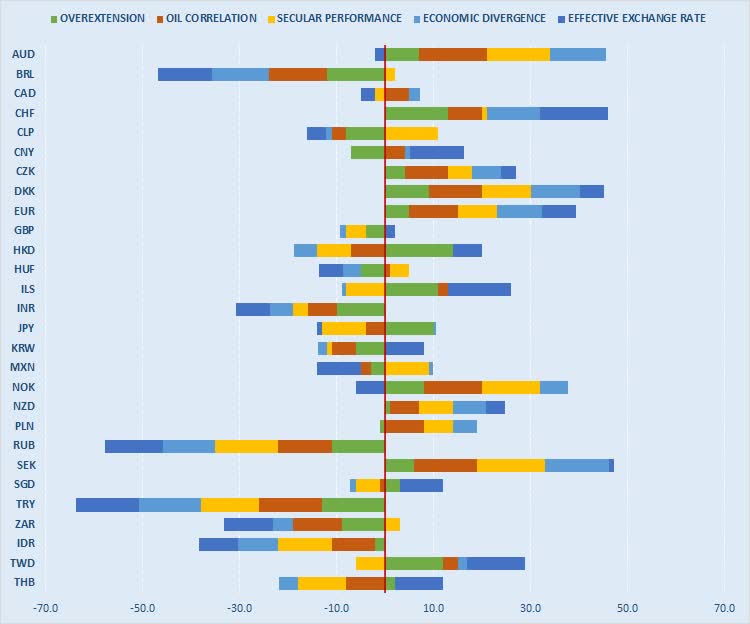 Source: FXCM, Bluegold Trader (website), personal calculations
On balance, Swedish krona, Swiss franc and Danish krone appear to be the most overrated currencies, with a net score of +47, +46 and +45, respectively (see the chart above). Australian dollar and the euro are not far behind, at +44 and +39 respectively. The most “underrated” or undervalued currencies are Turkish lira (-64), Russian ruble (-58) Brazilian real (-45) and Indonesian rupiah (-38).
When looking solely at the major currencies, we see that the Swiss franc, Australian dollar and euro stand out among the rest as the most “overvalued” currencies on the basis of all six studies. Conversely, Canadian dollar and British pound appear to be the most “undervalued” currency among the majors (see the chart below).
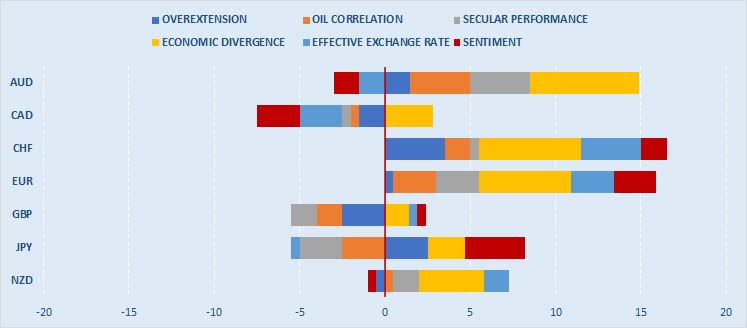 Source: FXCM, Bluegold Trader (website), personal calculations
What is important is that the relative overvaluation of the Swiss franc and euro is rather broad-based. In other words, the results are above zero for all econometric studies plus traders’ sentiment analysis. However, the relative undervaluation of the Canadian dollar is less extensive. For instance, economic divergence analysis indicates that the currency is more or less fairly valued.
If you are a contrarian investor, you will want to short the most overvalued currency against the most undervalued currency. At this point in time, the most contrarian trades among the major currencies are the following:
- Sell CHF/GBP
- Sell CHF/CAD
- Sell EUR/GBP
- Sell EUR/CAD
In other words, sell Swiss franc and the euro and buy British pound and Canadian dollar. However, one needs to be careful here because technicals do not yet support the bearish case for either CHF or EUR (see the very first table above).
Now let’s look at the econometric studies.
Econometric Studies
Over-Extension Analysis
Over-extension analysis ranks the exchange rates in percentages of their respective trading ranges over the past years and allows us to see how far each currency has deviated from its historical (three-year) trading range. I choose to look at the three-year period for several reasons. First of all, it is long enough to capture more than half of a standard business cycle of most economies (according to the National Bureau of Economic Research, the average length of a business cycle is about 69 months, or a little less than six years). At the same time, a three-year range is short enough to be relevant and not to produce too smoothed-out results. In other words, analytical curves maintain some healthy volatility and tend to generate actionable trading signals.
The most overextended currency is the Swiss franc. As of Thursday, it was trading at 94.09% of its three-year range. The most lagging currency is the British pound, trading at 46.25% of its three-year range.
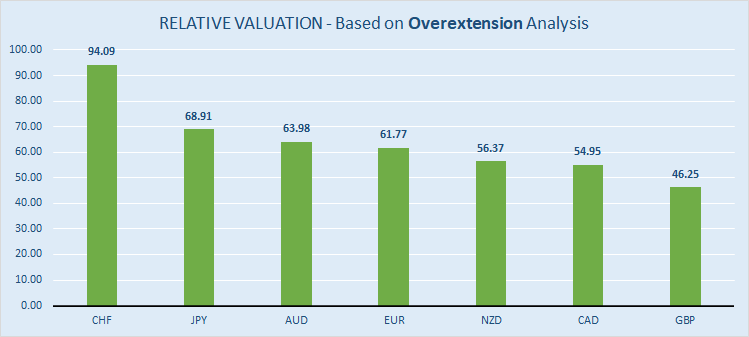
Source: FXCM, Bluegold Trader (website), personal calculations
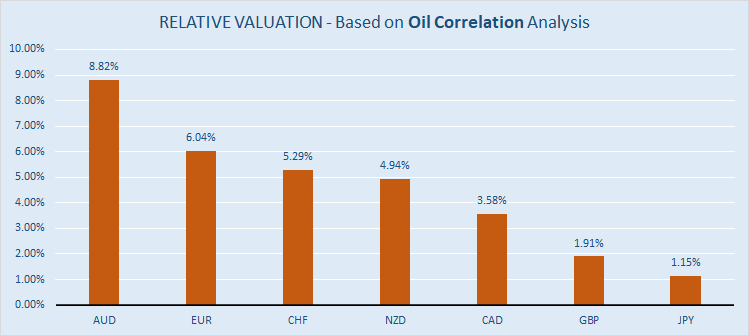
Oil Correlation
Oil correlation study simply examines the link between a country’s exchange rate and the price of oil. This relationship is quite critical because oil prices serve as an important proxy for future changes in the Consumer Price Index, which influences countries’ macroeconomic policies, which, in turn, affect the exchange rate. Based on the 24-month running oil price standard correlations, I have calculated that the Australian dollar is overvalued by 8.82%, while the Japanese yen is overvalued by only around 1.15%.
Source: FXCM, Bluegold Trader (website), personal calculations
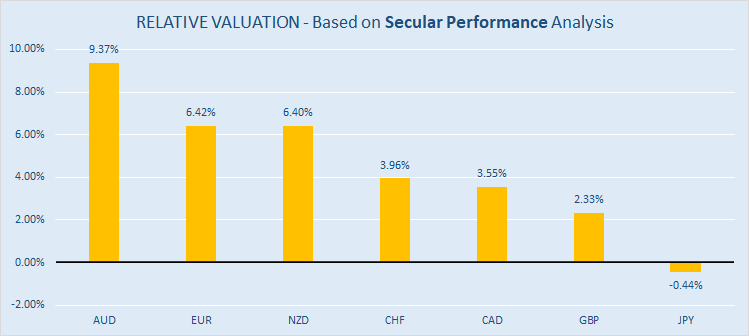
Secular Performance
Assessing the strength of any given currency is quite tricky. Because we usually measure the performance of one currency against the other, the result is always biased. For example, a rising GBP/USD may not necessarily reflect improved fundamentals in the United Kingdom, but rather point to deteriorating fundamentals in the United States. A less-biased approach would be to compare a currency’s performance against some kind of neutral asset, such as gold. Analysts call it a secular performance analysis.
Secular performance is a useful, but underused concept in forex trading. It is an important measure because gold (it is assumed) has some intrinsic value as opposed to fiat currency, which is just a “legal tender” not backed by any physical commodity. In the end, the price of gold will be determined by supply and demand rather than by central banks’ monetary policy and the printing press. Analyzing currency performance against that of gold allows us to see the scale of “real” demand for this or that currency.
Based on the 24-month running secular performance observations, I have calculated that the Australian dollar is overvalued by 9.37% while the Japanese yen is undervalued by 0.44%.
Source: FXCM, Bluegold Trader (website), personal calculations
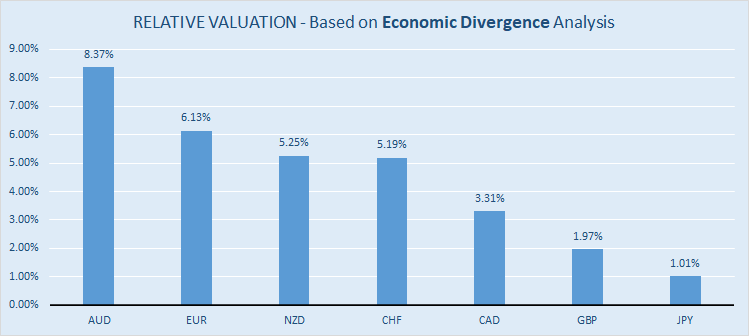
Economic Divergence
As a general rule, economic data should always justify the moves in currencies’ exchange rates. However, it is difficult (if not downright useless) to cherry-pick a single economic indicator and compare it to a currency’s performance, because the relative importance of any given economic indicator will vary depending on the economy in question. For example, trade balance data can influence the exchange rate of commodity exporters, such as Australia and New Zealand, but it is less relevant for the United States, whose dollar is a global “safe haven” (at least for now). In theory, GDP growth should act as an ultimate barometer of economic health, but GDP data is released too infrequently (usually on a quarterly basis) to be relevant in my analysis. Instead, I prefer to look at countries’ bond yields.
Two-year bond yields are considered to be an important measuring stick for market confidence and investor appetites. Most importantly, yields essentially reflect investors’ and traders’ expectations of central banks’ monetary policy, which is a major driver for the exchange rates. Therefore, the difference between two countries’ two-year bond yields should indicate which country is running a more expansionary monetary policy (which should be bearish for that country’s currency) and which country is in the contraction stage (which should be bullish for that country’s currency). Usually, the currency of the country with the higher bond yield appreciates against the currency of the country with the lower bond yield.
Additionally, I look at the yield spread between the 10-year government bond and the 2-year government bond (10-2 YIELD SPREAD). The yield spread is often included among the leading forex indicators because interest-rate differentials determine the shape of the yield curve and the shape of the yield curve embodies fixed-income traders’ expectations about the economy.
Based on the 24-month running bond spreads correlations, I have calculated that the Australian dollar is overvalued by 8.37% while Japanese yen is overvalued by 1.01%.
Source: FXCM, Bluegold Trader (website), personal calculations
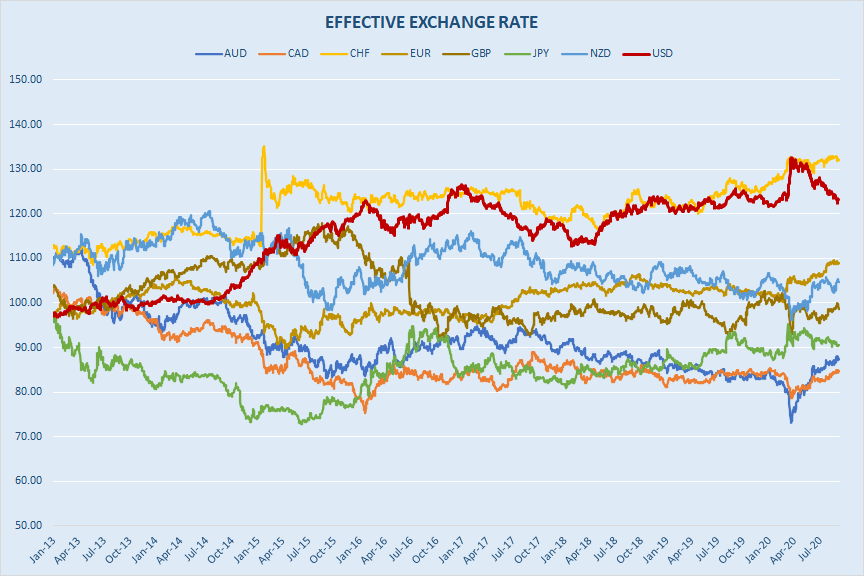
Effective Exchange Rate
Effective exchange rate (EER) equals nominal exchange rate (calculated as geometric weighted averages of bilateral exchange rates) adjusted for relative consumer prices. The most recent weights are based on trade in the 2014-16 period, with 2010 as the indices’ base year.
As you can see from the chart below, the Swiss franc has appreciated the most among its peers, followed by the U.S. dollar, while the Australian dollar, the Canadian dollar and the Japanese yen are clearly lagging behind. Overall, the EER analysis does confirm the relative overvaluation of the Swiss franc (131.94) and the relative undervaluation of the Canadian dollar (84.66) – see the charts below.
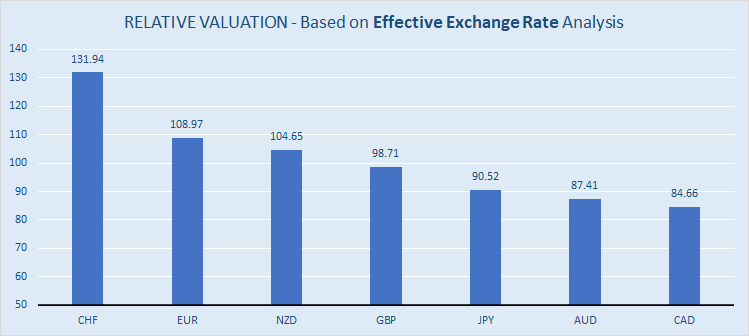
Source: Central bank official statistics, Bluegold Trader (website)
Positioning
Commitments of Traders reports issued by the help me analyze traders’ sentiment. In all my studies, I am on the lookout for potential extremes over a three-year period. Specifically, I monitor net positions by non-commercial traders (large speculators, such as hedge funds) and convert them to the scale from 0 to 100. A reading close to 0 suggests that commitments are close to the lower bound of a three-year range, while a reading close to 100 suggests that commitments are approaching the upper bound. For me, overbought conditions are present when non-commercial positions are at 90 and higher, while oversold conditions are present when non-commercial positions are at 10 and lower. On this measure, the most overbought currency is the Japanese yen (97.57), while the least overbought currency in the Canadian dollar (27.69).
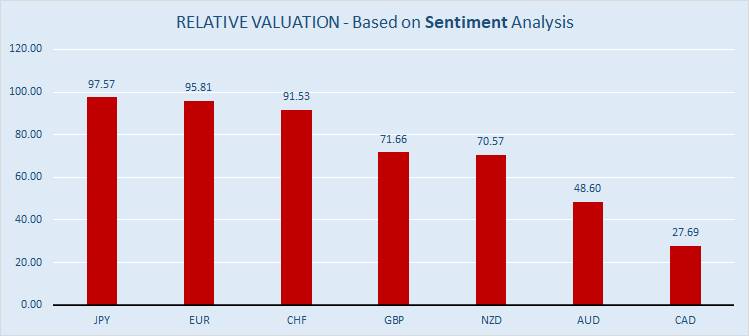
Sources: CFTC, Bluegold Trader (website), personal calculations
Trading Opportunities
I see several trading opportunities based on the above results:
- Sell CHF/GBP – Once the pair drops below 0.8570, target 0.8500 and 0.8420 (in extension).
- Sell CHF/CAD – Once the pair drops below 1.4480, target 1.4400 and 1.4260 (in extension).
- Sell EUR/CAD – As long as the pair is trading below 1.5650, look for opportunities to go short; target 1.5500 and 1.5420 (in extension).
- Sell EUR/GBP – Look for the confirmation of the near-term top, then consider a minor short position; target 0.9270 and 0.9120 (in extension).
Disclosure: I/we have no positions in any stocks mentioned, and no plans to initiate any positions within the next 72 hours. I wrote this article myself, and it expresses my own opinions. I am not receiving compensation for it (other than from Seeking Alpha). I have no business relationship with any company whose stock is mentioned in this article.